

Highlights
Results
Latest Quarterly Results
Quarterly Report: 3rd Quarter 2013 (Ended 30 September 2013)
download pdfCondensed Consolidated Statement Of Comprehensive Income For The Third Quarter Ended 30 September 2013
(The figures have not been audited)

Condensed Consolidated Statement Of Financial Position As At 30 September 2013
(The figures have not been audited)

Review Of Performance

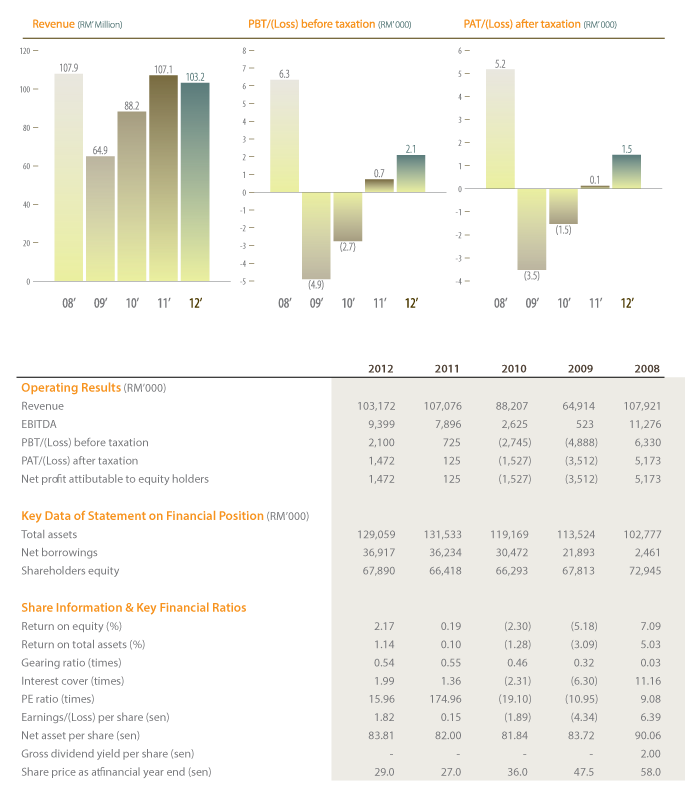
Revenue for the current quarter closed at RM22.1 million. This was 20.5% or RM5.7 million lower than the previous year’s corresponding quarter. The exports market underperformed due to decline in demand in some of the Asian countries that we export to.
Margin was also affected with higher labour cost with the implementation of the minimum wages for labour and higher absorption of fixed overheads with lower output in the quarter.
As a result of soft demand in the last two quarters, the Group registered a cumulative revenue of RM70.3 million which was a decline of 6.9% from the preceding year’s corresponding period. The reduction in revenue and lower margin due to the above-mentioned factors had affected the profit margin of the Group. Last year’s margin was also comparatively higher due to the supply of an oversea’s high value project with very favourable margin.
The Group’s property division is in the process of obtaining the necessary approval from the relevant authorities on its development project.
Current Year Prospects
There are more local projects for the final quarter while exports sales is projected to remain low. Thus, the Group expects to achieve a higher turnover than the current quarter. The Group will endeavor to contain its cost to improve its margin.
Archives
Financial Archives
2013
Quarterly Report 2013
| 3rd Quarter (Ended 30 September 2013) | : | download pdf |
| 2nd Quarter (Ended 31 June 2013) | : | download pdf |
| 1st Quarter (Ended 31 March 2013) | : | download pdf |
2012
Quarterly Report 2012
| 4th Quarter (Ended 31 December 2012) | : | download pdf |
| 3rd Quarter (Ended 30 September 2012) | : | download pdf |
| 2nd Quarter (Ended 30 June 2012) | : | download pdf |
| 1st Quarter (Ended 31 March 2012) | : | download pdf |
2011
Quarterly Report 2011
| 4th Quarter (Ended 31 December 2011) | : | download pdf |
| 3rd Quarter (Ended 30 September 2011) | : | download pdf |
| 2nd Quarter (Ended 30 June 2011) | : | download pdf |
| 1st Quarter (Ended 31 March 2011) | : | download pdf |
2010
Quarterly Report 2010
| 4th Quarter (Ended 31 December 2010) | : | download pdf |
| 3rd Quarter (Ended 30 September 2010) | : | download pdf |
| 2nd Quarter (Ended 30 June 2010) | : | download pdf |
| 1st Quarter (Ended 31 March 2010) | : | download pdf |
2009
Quarterly Report 2009
| 4th Quarter (Ended 31 December 2009) | : | download pdf |
| 3rd Quarter (Ended 30 September 2009) | : | download pdf |
| 2nd Quarter (Ended 30 June 2009) | : | download pdf |
| 1st Quarter (Ended 31 March 2009) | : | download pdf |
2008
Quarterly Report 2008
| 4th Quarter (Ended 31 December 2008) | : | download pdf |
| 3rd Quarter (Ended 30 September 2008) | : | download pdf |
| 2nd Quarter (Ended 30 June 2008) | : | download pdf |
| 1st Quarter (Ended 31 March 2008) | : | download pdf |
2007
Quarterly Report 2007
| 4th Quarter (Ended 31 December 2007) | : | download pdf |
| 3rd Quarter (Ended 30 September 2007) | : | download pdf |
Ratios
Financial Ratios
| Period | Full Year Dec 2012 |
Full Year Dec 2011 |
Full Year Dec 2010 |
|---|---|---|---|
| EPS (MYR) (Earnings / Latest No. of Shares) |
0.01817 | 0.00154 | -0.01885 |
| NAV (MYR) (Shareholders’ Equity / Latest No. of Shares) |
0.8381 | 0.8200 | 0.8184 |
| Price Earnings Ratio (PER) (Price/EPS) |
20.91 | 246.75 | -20.16 |
| Net Earnings Margin (Net Earnings / Revenue) |
1.43 % | 0.12 % | -1.73 % |
| Revenue Growth ((Current Year Revenue – Last Year Revenue) / Last Year Revenue) |
-3.65 % | 21.39 % | 35.88 % |
| Net Earnings Growth ((Current Year Earnings – Last Year Earnings) / Last Year Earnings) |
1077.60 % | 0.00 | 56.52 % |
| Return On Asset (ROA) (Net Earnings / Total Assets) |
1.14 % | 0.10 % | -1.28 % |
| Return On Equity (ROE) (Net Earnings / Equity) |
2.17 % | 0.19 % | 0.00 |
| Current Ratio (Current Assets / Current Liabilities) |
1.23 % | 1.17 % | 1.48 % |
Notes
- Adjusted Fundamental Data is data that is adjusted for share splits, bonus issues, share consolidations, rights issues and other changes in share capital (such as placement shares). The latest number of shares is used to calculate these adjusted ratios and is applied right across all the full year results. ShareInvestor updates the total number of shares in issue on a best effort basis.
- Share splits, bonus issues, share consolidations and rights issues are updated on the ex-date whereas other changes in share capital are updated within 7 working days of the release of the company’s latest Results Announcement.
Calender
Financial Calender
| Date | Type | Remarks | |
|---|---|---|---|
| Historical Events | |||
| 25 Jun 2013 | AGM | 10.00 a.m. at Green II, Tropicana Golf & Country Resort, Jalan Kelab Tropicana, Off Jalan Tropicana Utama, 47410 Petaling Jaya, Selangor Darul Ehsan. | |
| 27 Jun 2012 | AGM | 10.00 a.m. at Green II, Tropicana Golf & Country Resort, Jalan Kelab Tropicana, Off Jalan Tropicana Utama, 47410 Petaling Jaya, Selangor Darul Ehsan. | |
| 27 Jun 2011 | AGM | 10.00 a.m at Green II, Tropicana Golf & Country Resort, Jalan Kelab Tropicana, Off Jalan Tropicana Utama, 47410 Petaling Jaya. | |
| 26 Jun 2009 | Ex-Dividend | 1st & Final Dividend 2 Sen T.E. Record Date: 30 Jun 2009 Payable Date: 16 Jul 2009 |
|
| 26 Jun 2008 | Ex-Dividend | 1st & Final Dividend 2.8 Sen T.E. Record Date: 30 Jun 2008 Payable Date: 17 Jul 2008 |
|
Notes
- Dates with early, mid or late descriptions are based on the dates from the previous year’s results. These are not indicative of future result announcements dates.
Shareholdings
Shareholdings
As at 23rd April 2013
| Authorised Share Capital | : | RM100,000,000.00 comprising 200,000,000 ordinary shares of RM0.50 each |
| Issued and Fully Paid-Up Share Capital | : | RM81,000,000.00 |
| Class of Shares | : | Ordinary shares of RM 0.50 each |
| Voting Rights | : | One vote per ordinary share |
ANALYSIS BY SIZE OF SHAREHOLDINGS

SUBSTANTIAL SHAREHOLDERS AS PER THE REGISTER OF SUBSTANTIAL SHAREHOLDERS
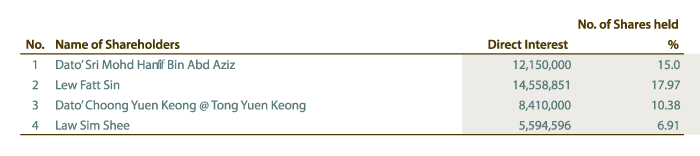
DIRECTORS’ SHAREHOLDINGS AS PER THE REGISTER OF DIRECTORS’ SHAREHOLDINGS

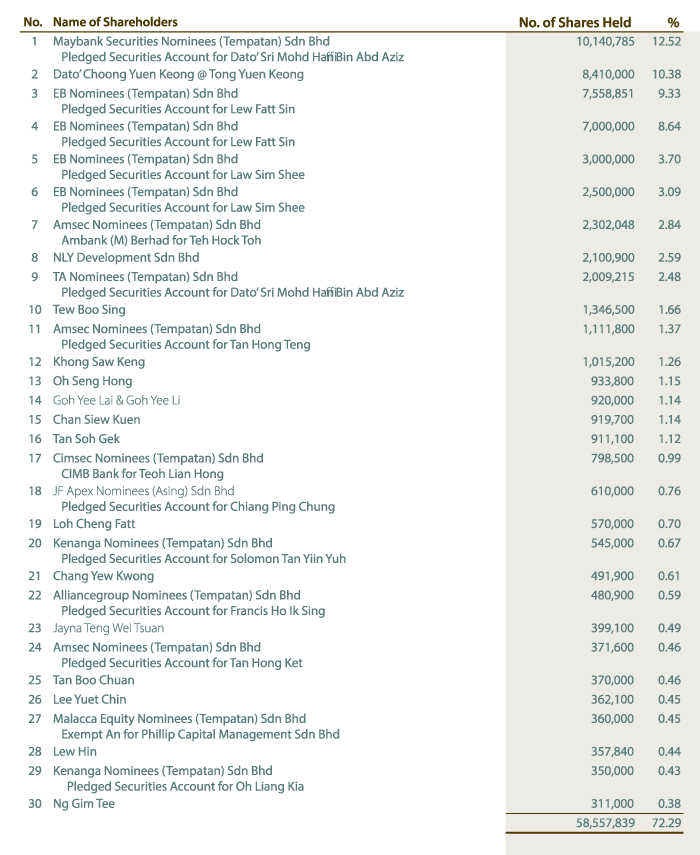
THIRTY (30) LARGEST SHAREHOLDERS
Annual Report

Previous Years
| 2011 Annual Report | download pdf | |
| 2010 Annual Report | download pdf | |
| 2009 Annual Report | download pdf | |
| 2008 Annual Report | download pdf | |
| 2007 Annual Report | download pdf | |
| 2006 Annual Report | download pdf | |
| 2005 Annual Report | download pdf | |
| 2004 Annual Report | download pdf |